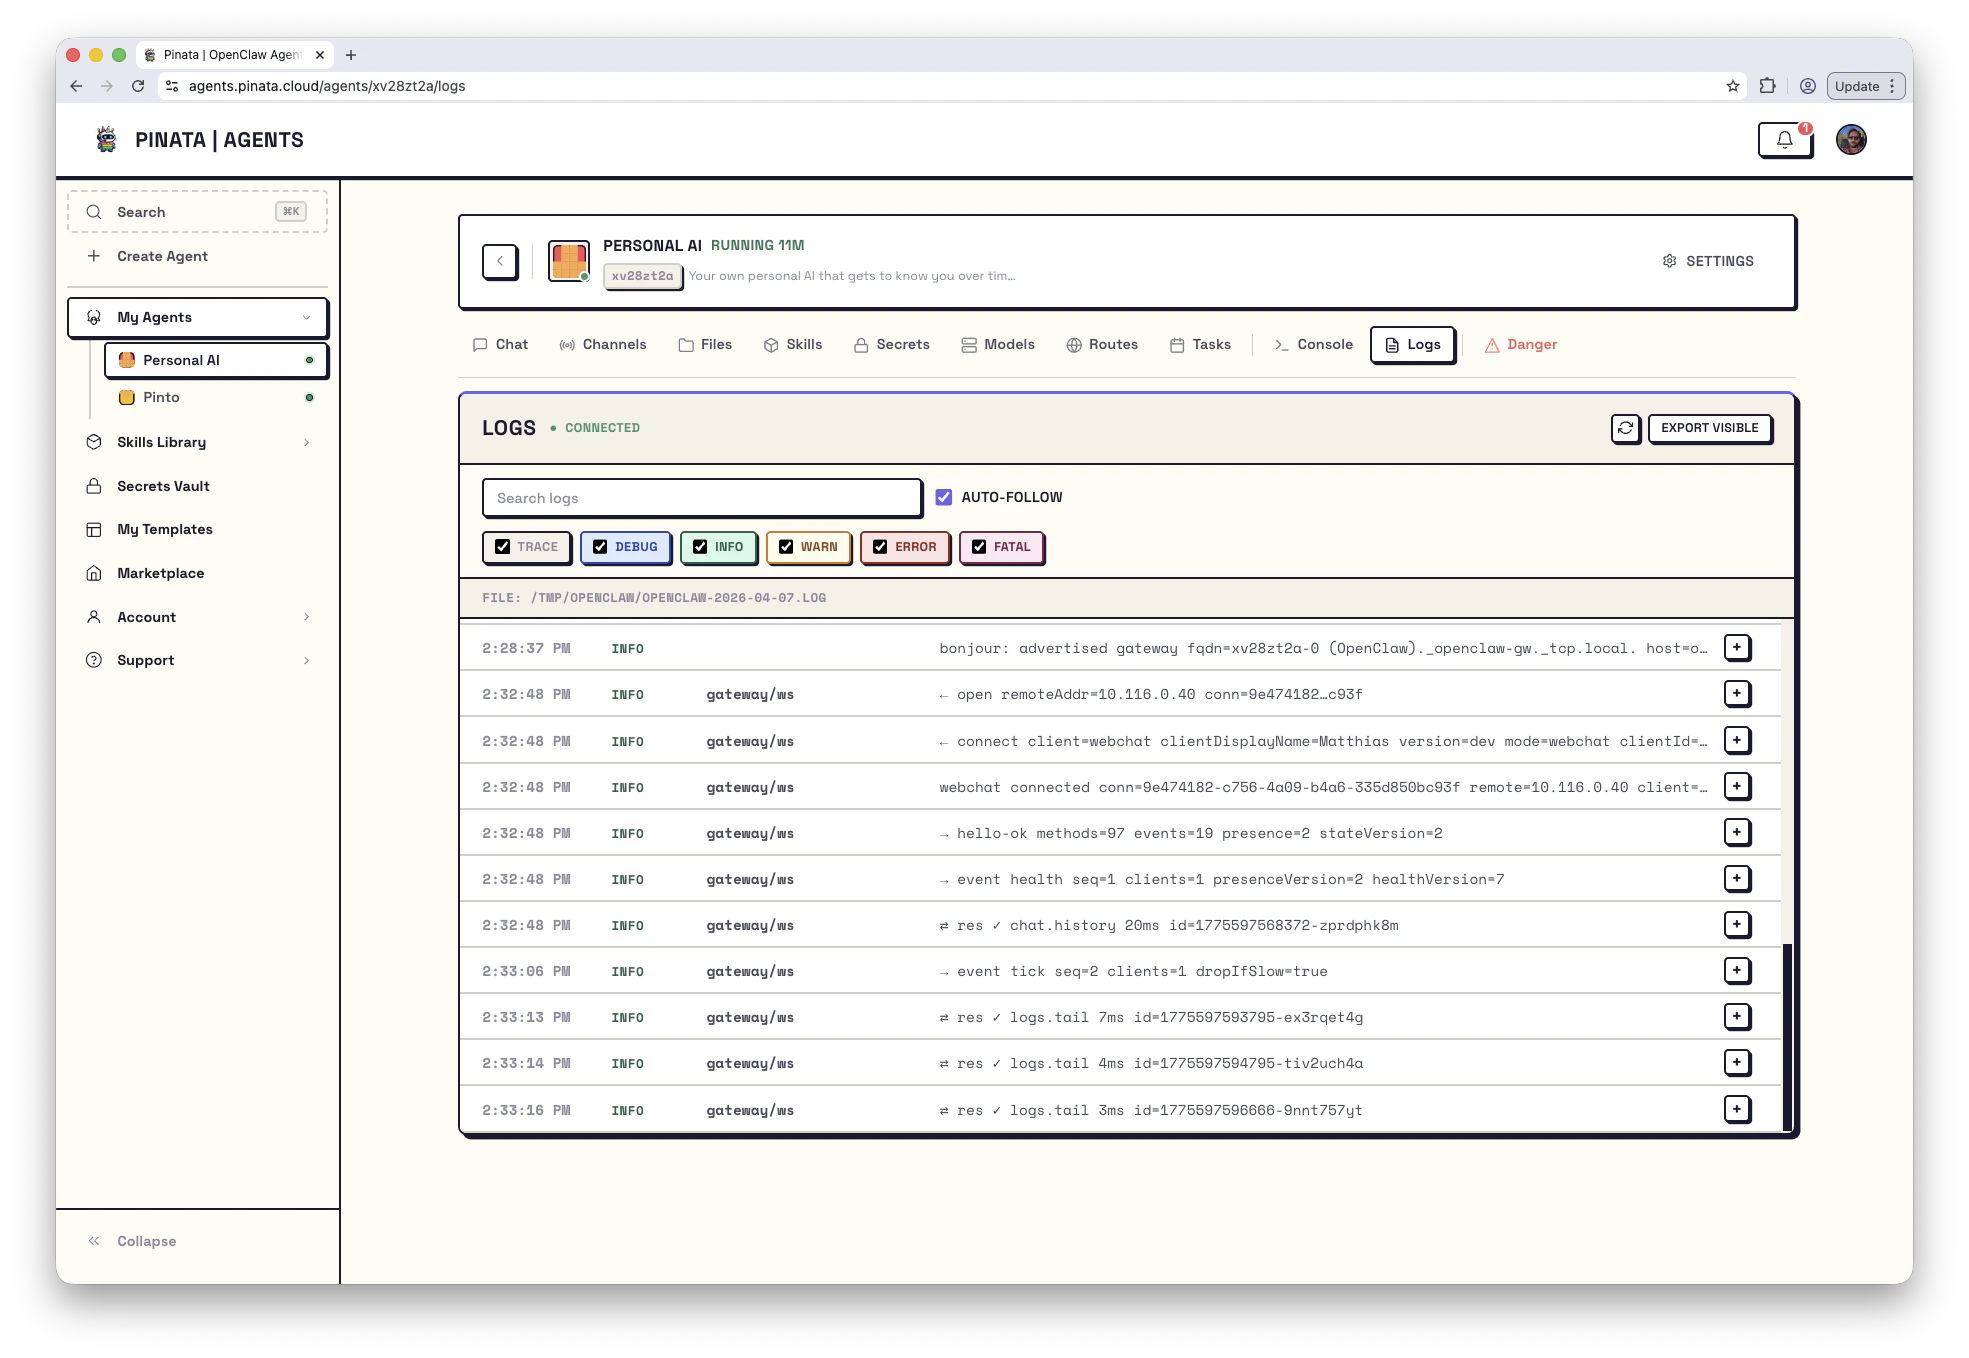
Reading the stream
Each log line has four parts:- Timestamp — when it happened
- Level — severity (
TRACE,DEBUG,INFO,WARN,ERROR,FATAL) - Source — which component generated the line (e.g.
gateway/reload,cron/runner) - Message — the content
Filtering
The six colored checkboxes — TRACE, DEBUG, INFO, WARN, ERROR, FATAL — toggle log levels on and off. When you’re hunting a problem, uncheck everything except WARN and above to cut the noise. The Search logs box does a substring match against the message. Combine with level filters: “show me ERROR lines mentioningtelegram.”
The AUTO-FOLLOW checkbox keeps the view pinned to the latest entry. Uncheck it when you want to scroll back without the view jumping.
Exporting
EXPORT VISIBLE downloads whatever the current filters are showing — useful for sharing with support or filing an issue. It’s only what you see; the export respects your filters.Where the logs live on disk
Inside an OpenClaw container, daily log files live at/tmp/openclaw/openclaw-{date}.log. From the Console:
Reading logs over the API
For scripts and incident response:Common sources, and what they tell you
If something’s broken, start at ERROR. If you see ERROR lines and can’t make sense of them, Troubleshooting maps symptoms to fixes, and the Error reference covers common API error responses.