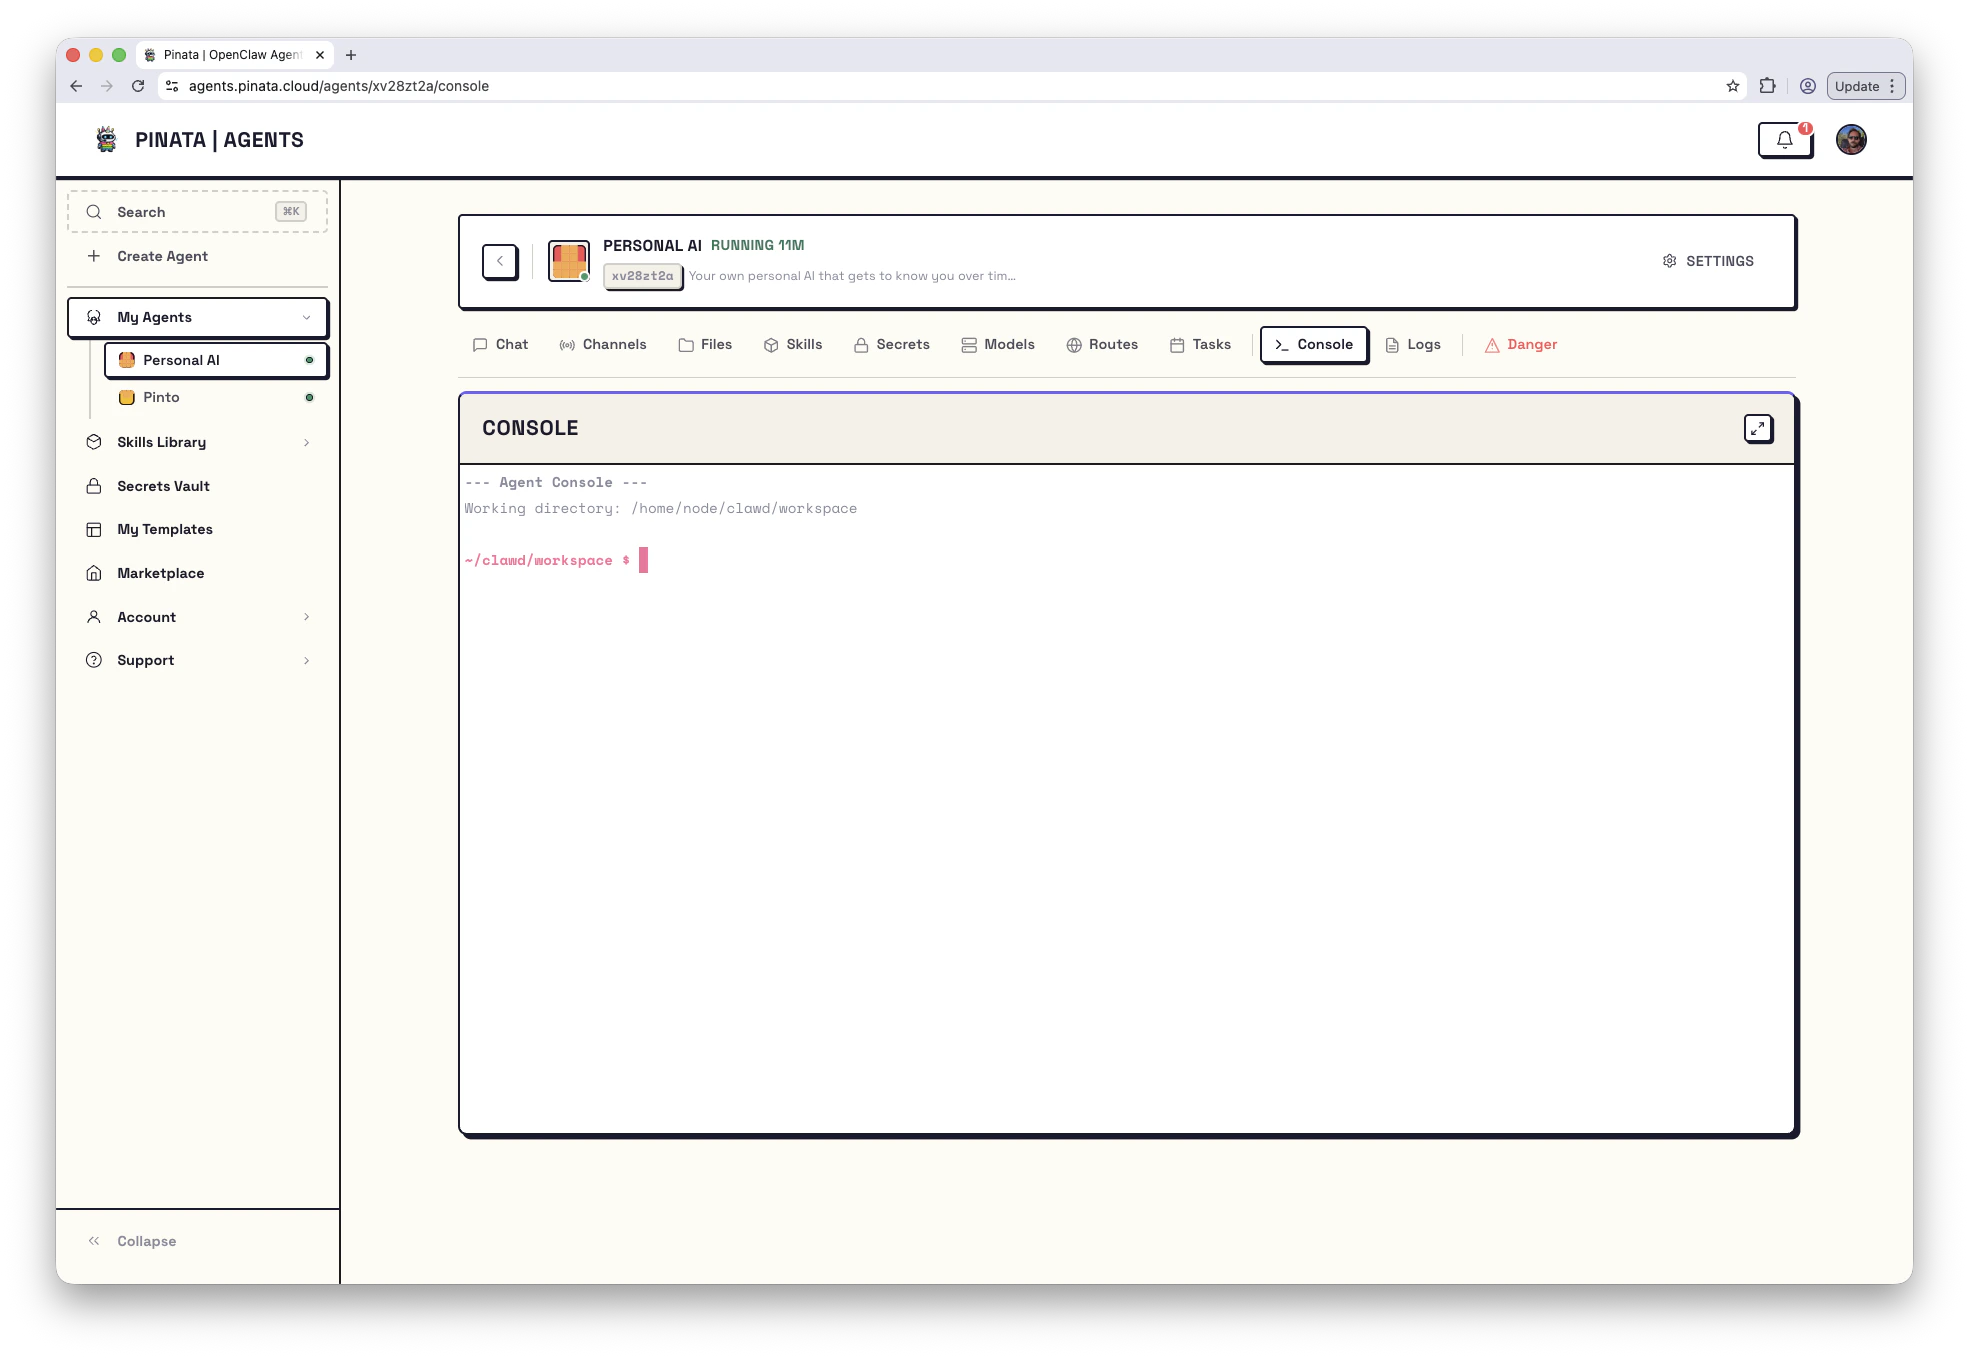
The Console tab is a shell. You get an interactive prompt inside your agent’s container, with the same workspace your agent reads and writes.
That example is an OpenClaw agent. Hermes agents use /home/hermes/data/workspace. The current path is also shown on the agent’s Danger tab.
Anything you can do with a shell, you can do here:
- Run
bash, python, node, git, curl, jq
- Tail log files:
tail -f /tmp/user-build.log
- Check what the agent sees:
env | sort
- Confirm a service is listening:
ss -tlnp
- Edit a file with
vi or nano
The session starts in the engine’s workspace directory — the same workspace shown on the Files and Danger tabs. Skills live under skills/, uploaded files under uploads/.
The button in the top-right of the panel switches to fullscreen mode, which is much more pleasant for anything beyond a one-liner.
When to reach for the Console
The Console is the second-best debugging tool, after Logs. Use it when:
- Logs show an error and you need to look at a file to understand it
- A lifecycle script failed and you want to read
/tmp/user-build.log or /tmp/user-start.log
- You want to confirm a process is actually running (
ps aux | grep <name>)
- You want to reproduce a one-off command the agent ran
Quick checks worth knowing:
For workflows by symptom, see Troubleshooting.
Running a command from outside the UI
If you’re scripting against an agent, hit the API:
Set cwd to the workspace path for that engine. For OpenClaw that’s /home/node/clawd/workspace; for Hermes that’s /home/hermes/data/workspace.
The response is JSON: { stdout, stderr, exitCode, command, timestamp }.
Console access is full shell access. Anyone with the gateway token has it. Treat the token like a server credential.