Sending a message
The composer is at the bottom of the page.- + opens an attachment picker. Files you attach land in
<workspace>/uploads/inside the container, and the agent gets the path in its context. - The text input is the message itself. Press Enter to send, Shift+Enter for a newline.
- MODEL picks which model handles this turn. It defaults to whatever you set as the agent’s default — see Models.
- The send arrow submits.
Slash commands
Type/ at the start of a message to run a command instead of a regular prompt:
The list depends on your agent engine and any skills you’ve attached, so
/help is the best way to see what’s actually available.
Reading agent responses
Each turn the agent sends back has a few elements you’ll see in the chat:- Thinking block — collapsed by default, labeled
Thinking ▾. Click it to expand. Only appears for models that expose reasoning. - Message text — the actual reply. Renders markdown, including code blocks and tables.
- Tool calls — if the agent called a tool (a shell command, a web search, a skill), you’ll see a labeled block with the arguments and result. This is your single best window into why the agent answered the way it did.
- Model badge — after the response, a small badge shows which model produced it. Useful when you’ve been switching models mid-conversation.
Switching models mid-conversation
Use the MODEL dropdown in the composer. You can switch between any models you’ve enabled for this agent — start a turn with a cheap, fast model, then bump up for a hard question. Each turn is tagged with the model that produced it, so the conversation stays readable. If you want to confirm what the agent is currently using without scrolling, send/status.
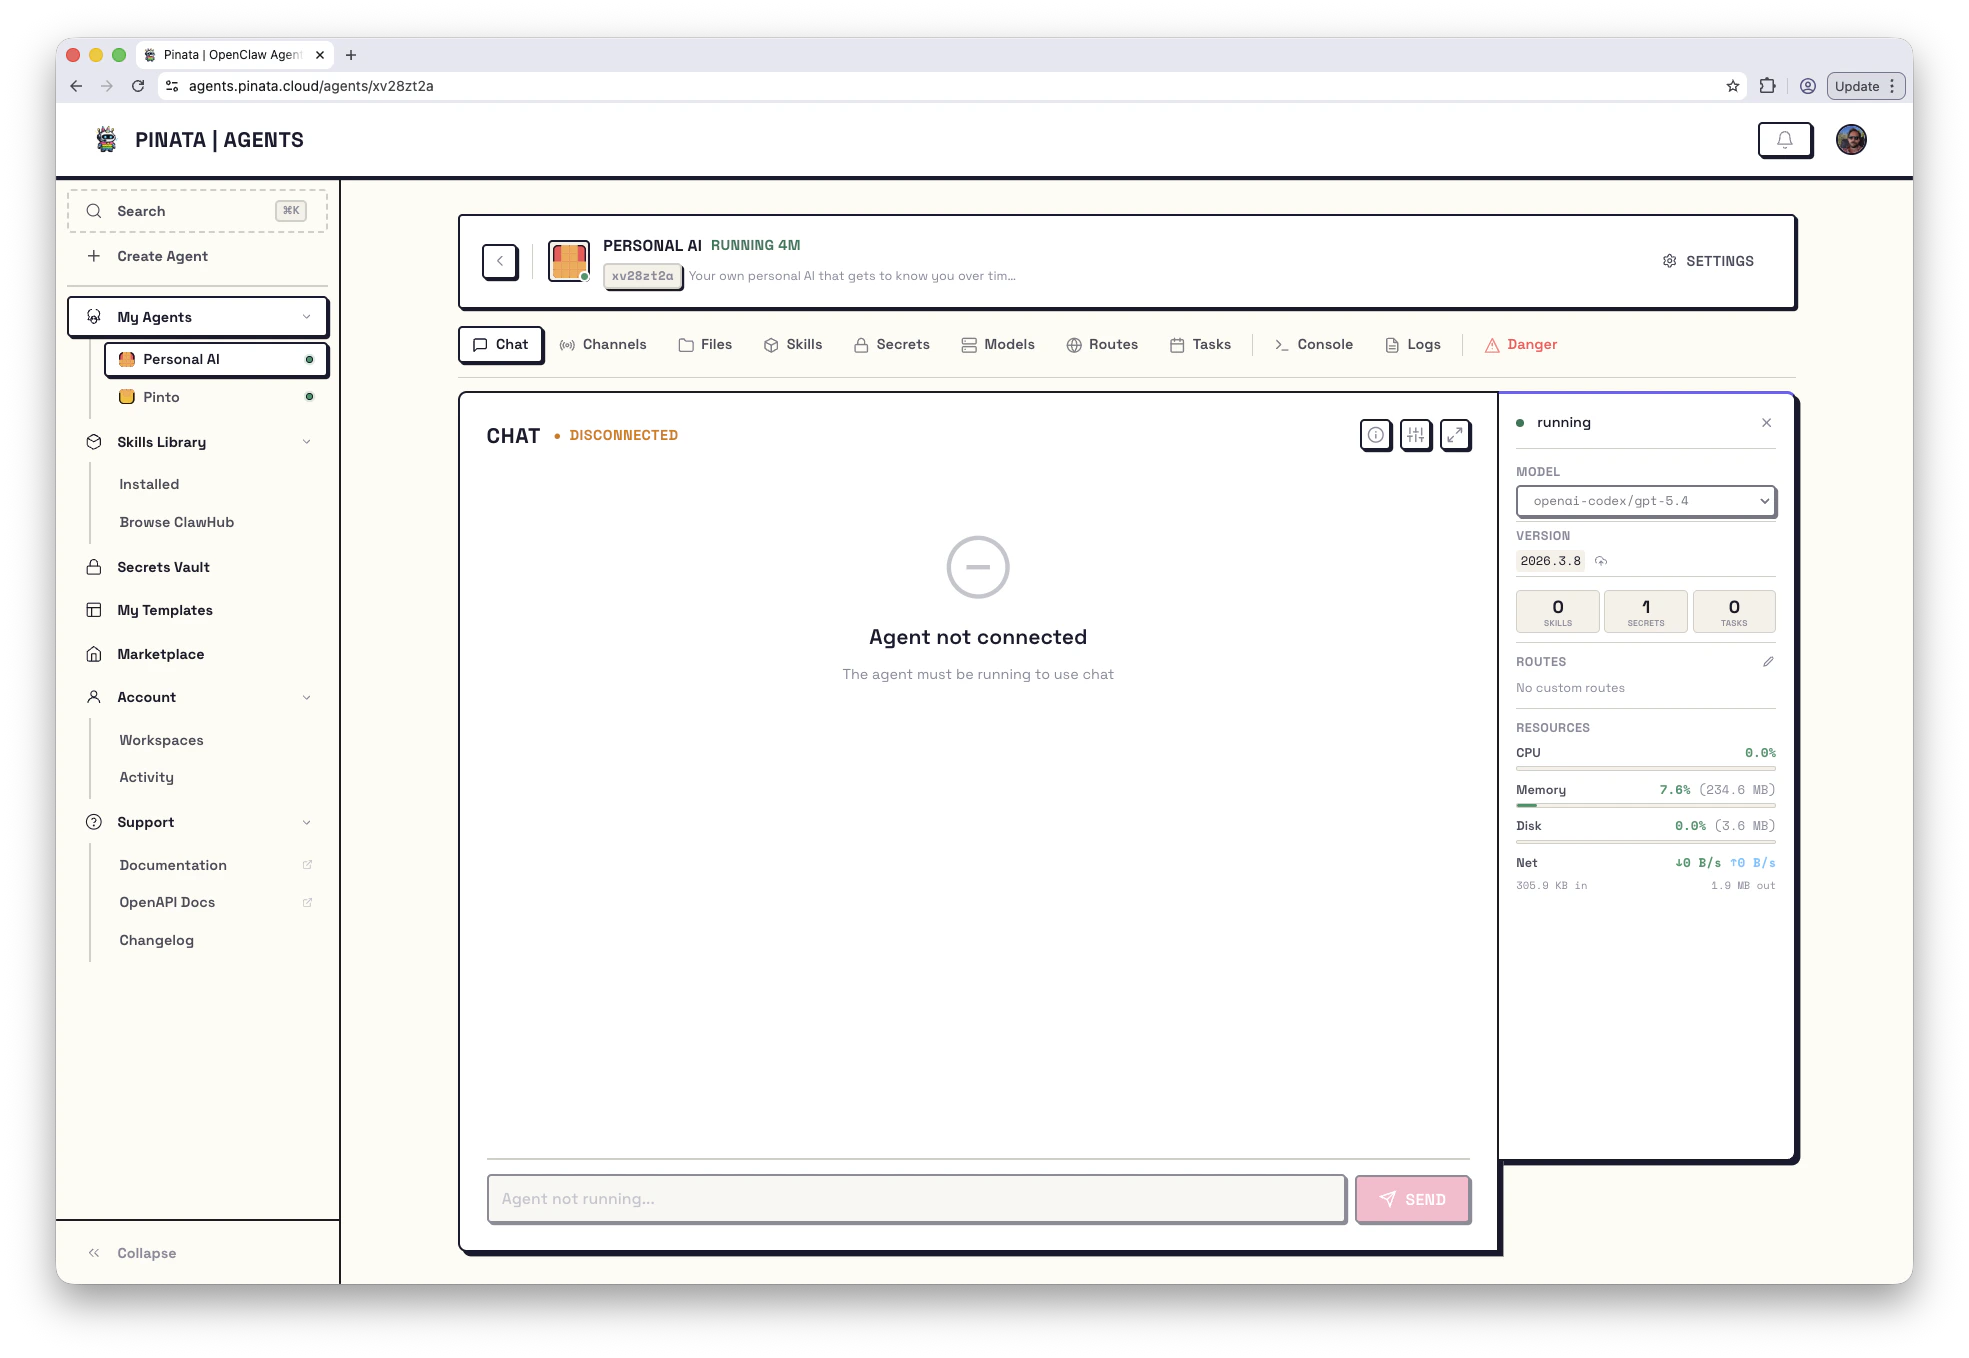
Chatting while the agent is stopped or restarting
You don’t have to wait for a stopped or restarting agent. The composer stays open (“Agent is starting — type a message and it’ll send when ready…”) and anything you send is queued:- Each queued message shows a QUEUED clock chip, with an × to cancel it before it sends
- A status line tracks the backlog — “3 messages queued · sending when the agent finishes starting…”
- Queued messages survive a page reload — refresh or navigate away mid-restart and they’re still waiting when you come back
- The moment the agent is back online, messages deliver automatically, in order, one at a time — no duplicates, and the agent answers each one individually
More room for the conversation
Click Hide navbar in the top-right corner to collapse the left sidebar — the conversation gets the full width of the screen. Click it again to bring the sidebar back.Tips
- Long-running tool calls show a progress indicator. Wait for it before assuming the agent is stuck.
- If the chat looks disconnected and stays that way, the gateway probably needs a kick. Open Danger → Restart Gateway. Messages you send during the restart queue up and deliver when it’s back.
- If you change a secret, attach a new skill, or add a channel, restart the gateway so the agent picks up the change. Attaching a new LLM provider restarts the agent with a fresh environment automatically.